React Charts
The React charts components with Tailwind CSS offer versatile solutions for displaying data visually on your dashboard. With Tailwind CSS, you can design charts ...
Search Components
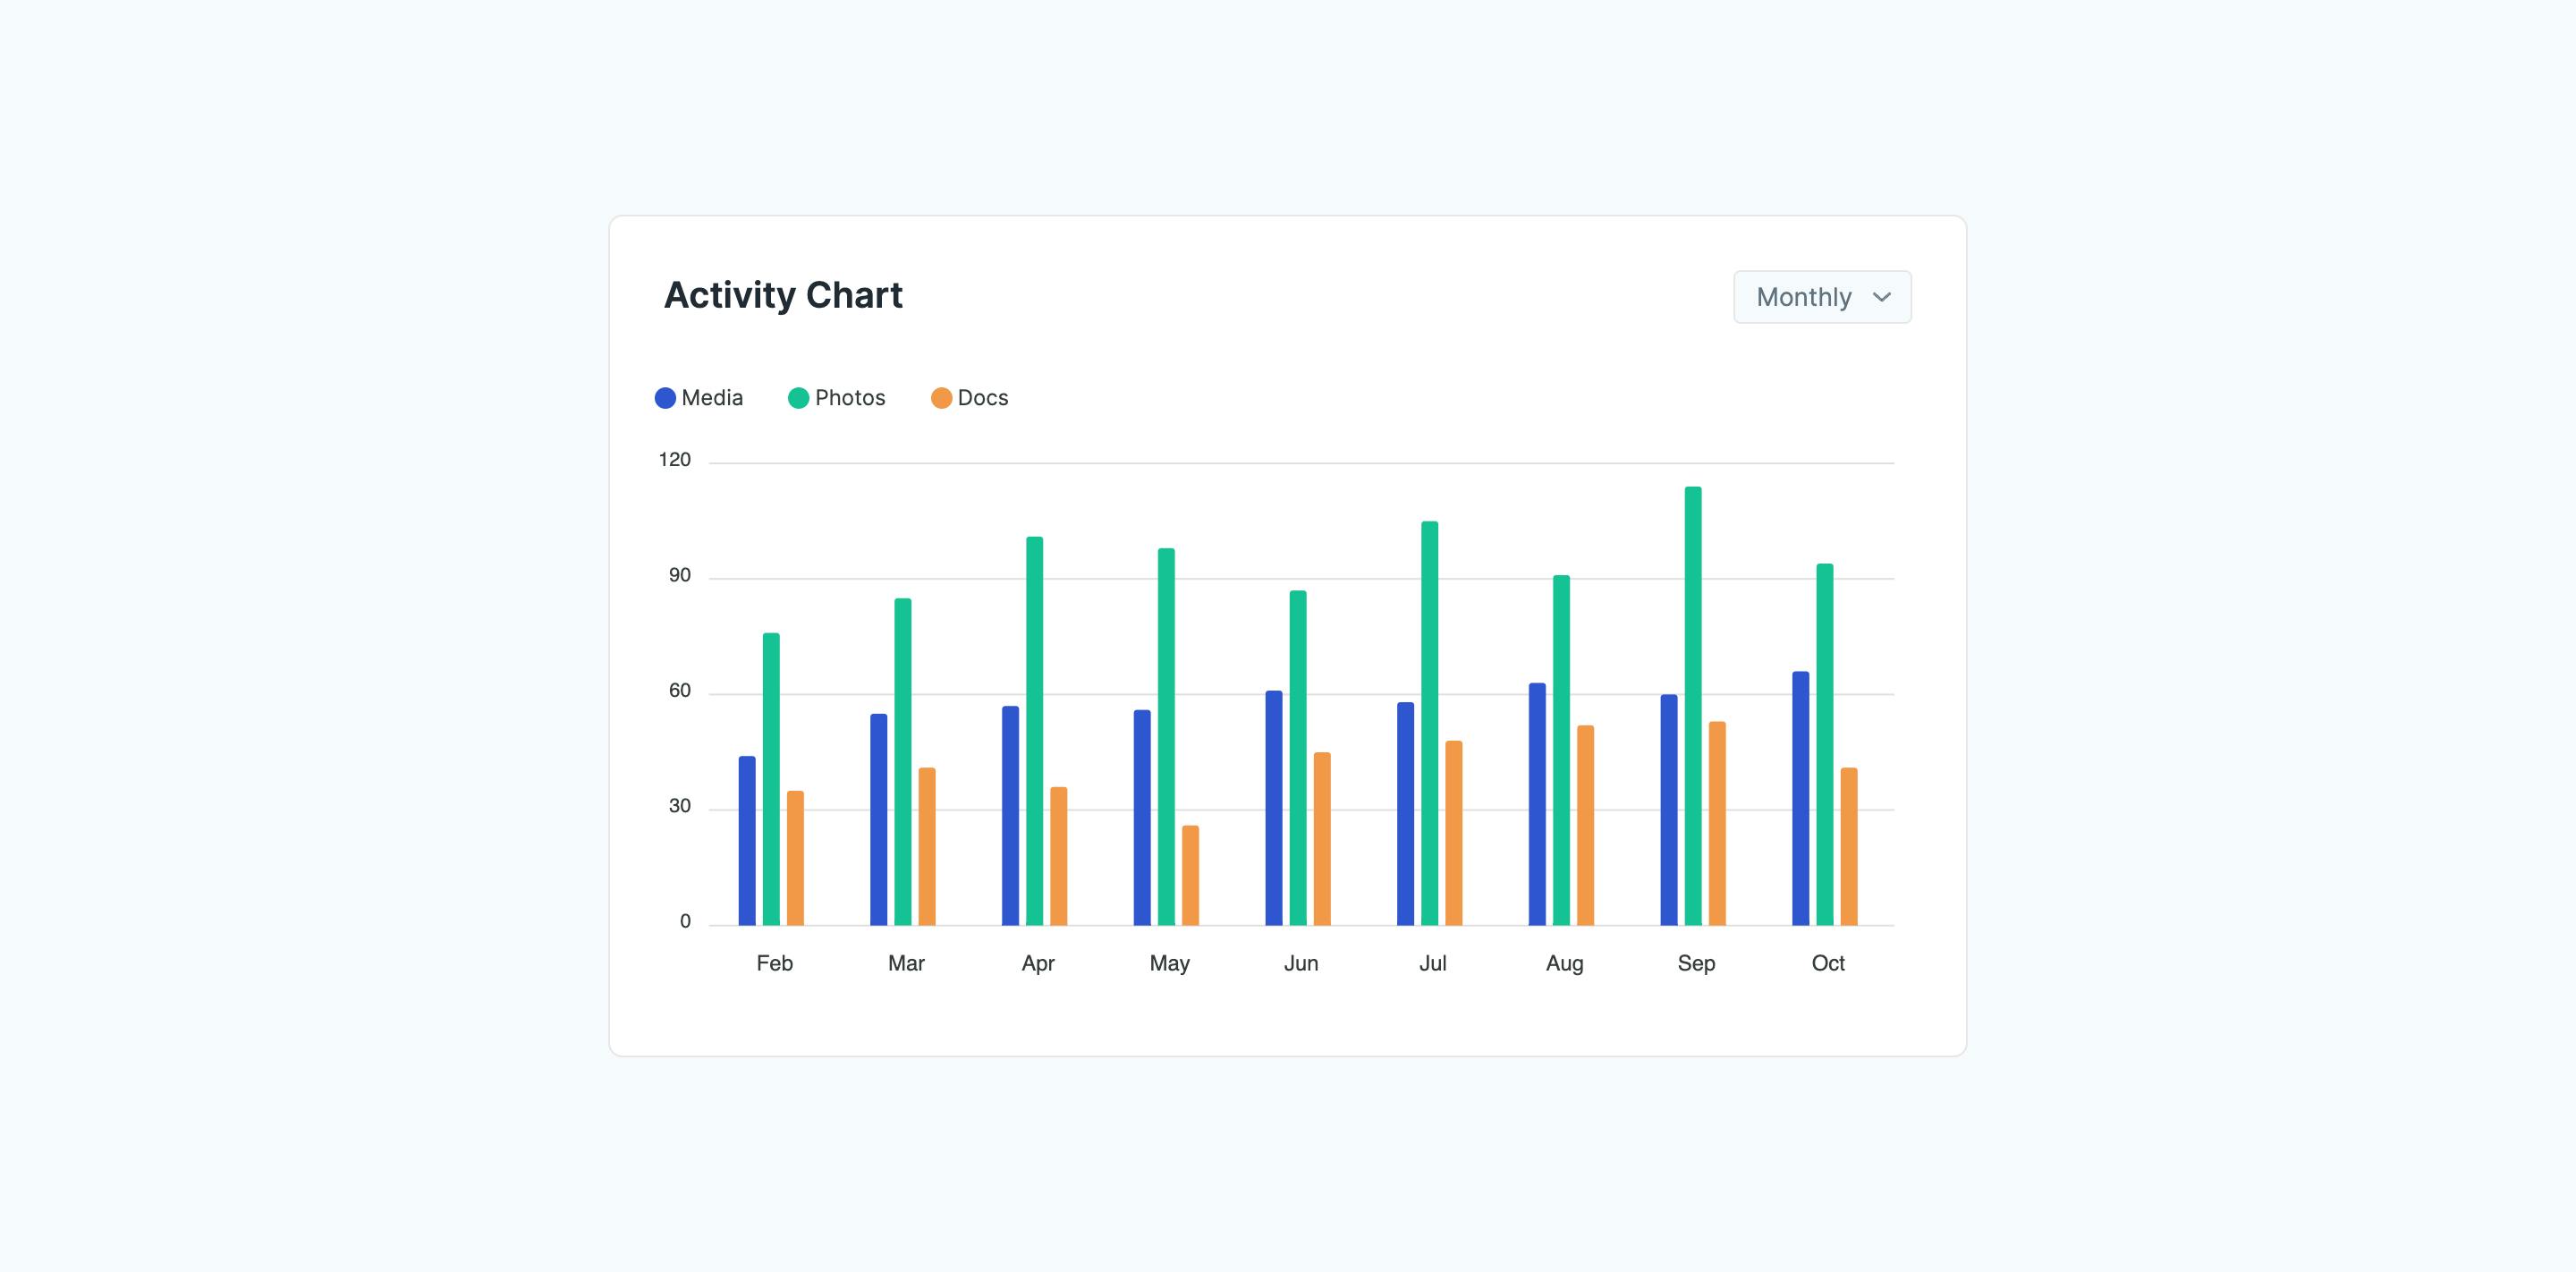
⌘KReact Bar Chart with Category Labels
A bar chart component for comparing categories over time. It features colored bars for each category, with the y-axis representing quantity or value. A dropdown menu lets users switch between monthly or yearly views.
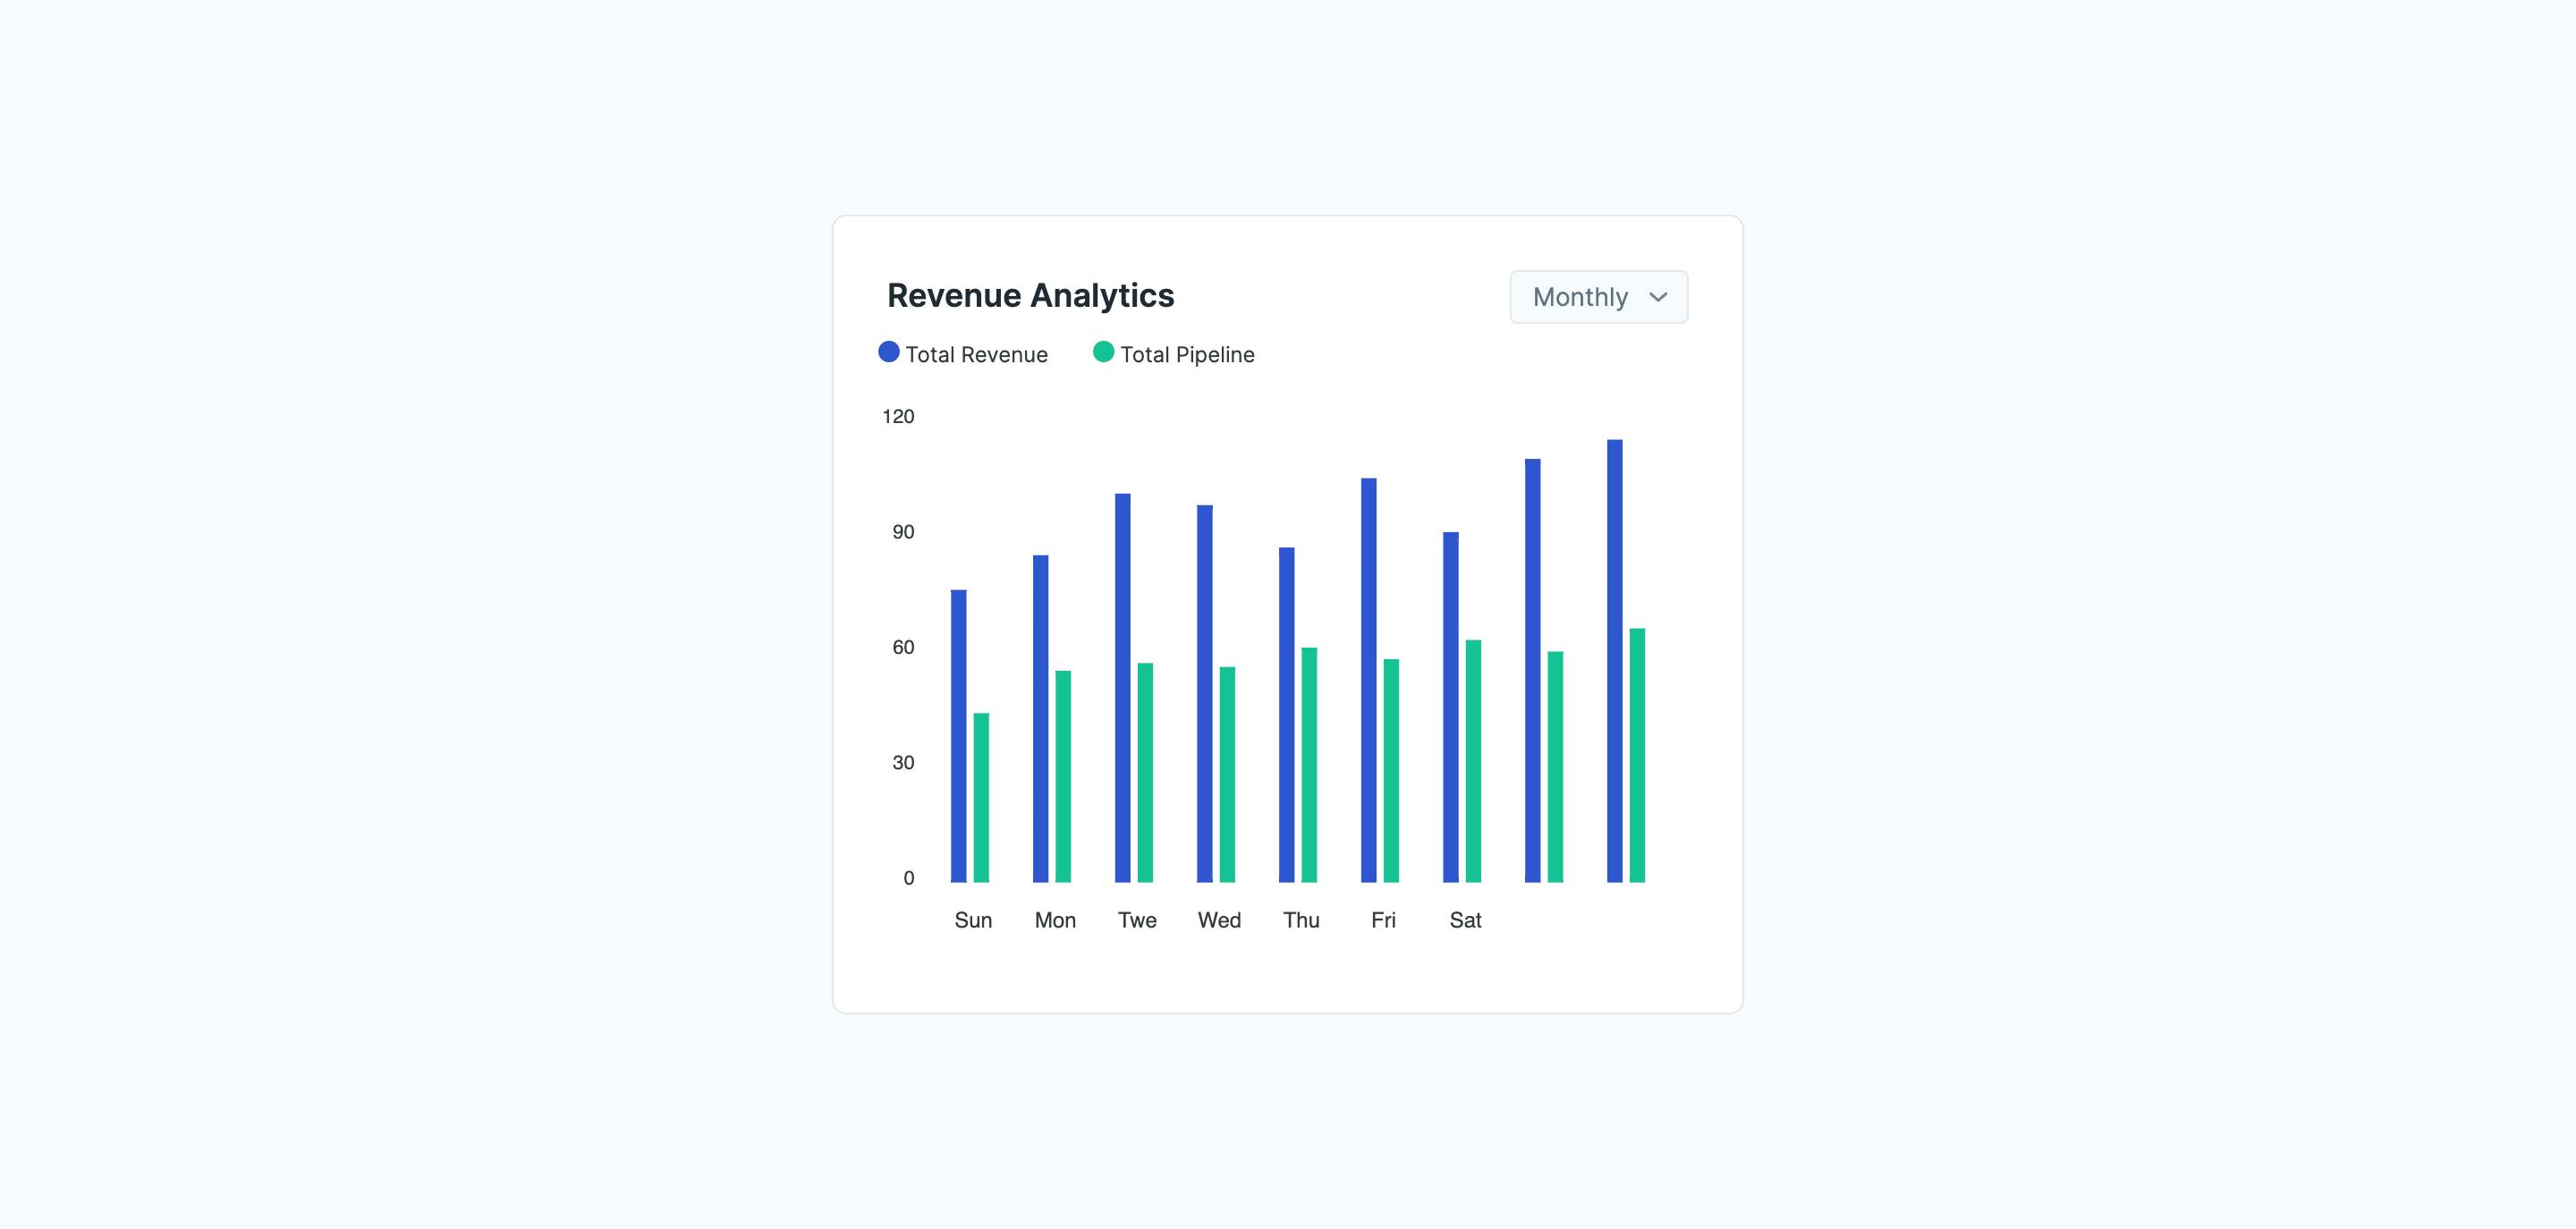
React Bar Chart with Monthly/Yearly Toggle
A bar chart component for comparing data over time. It features two data series represented by colored bars and a y-axis for quantity or value. Users can toggle between monthly and yearly views using a dropdown menu to analyze trends.
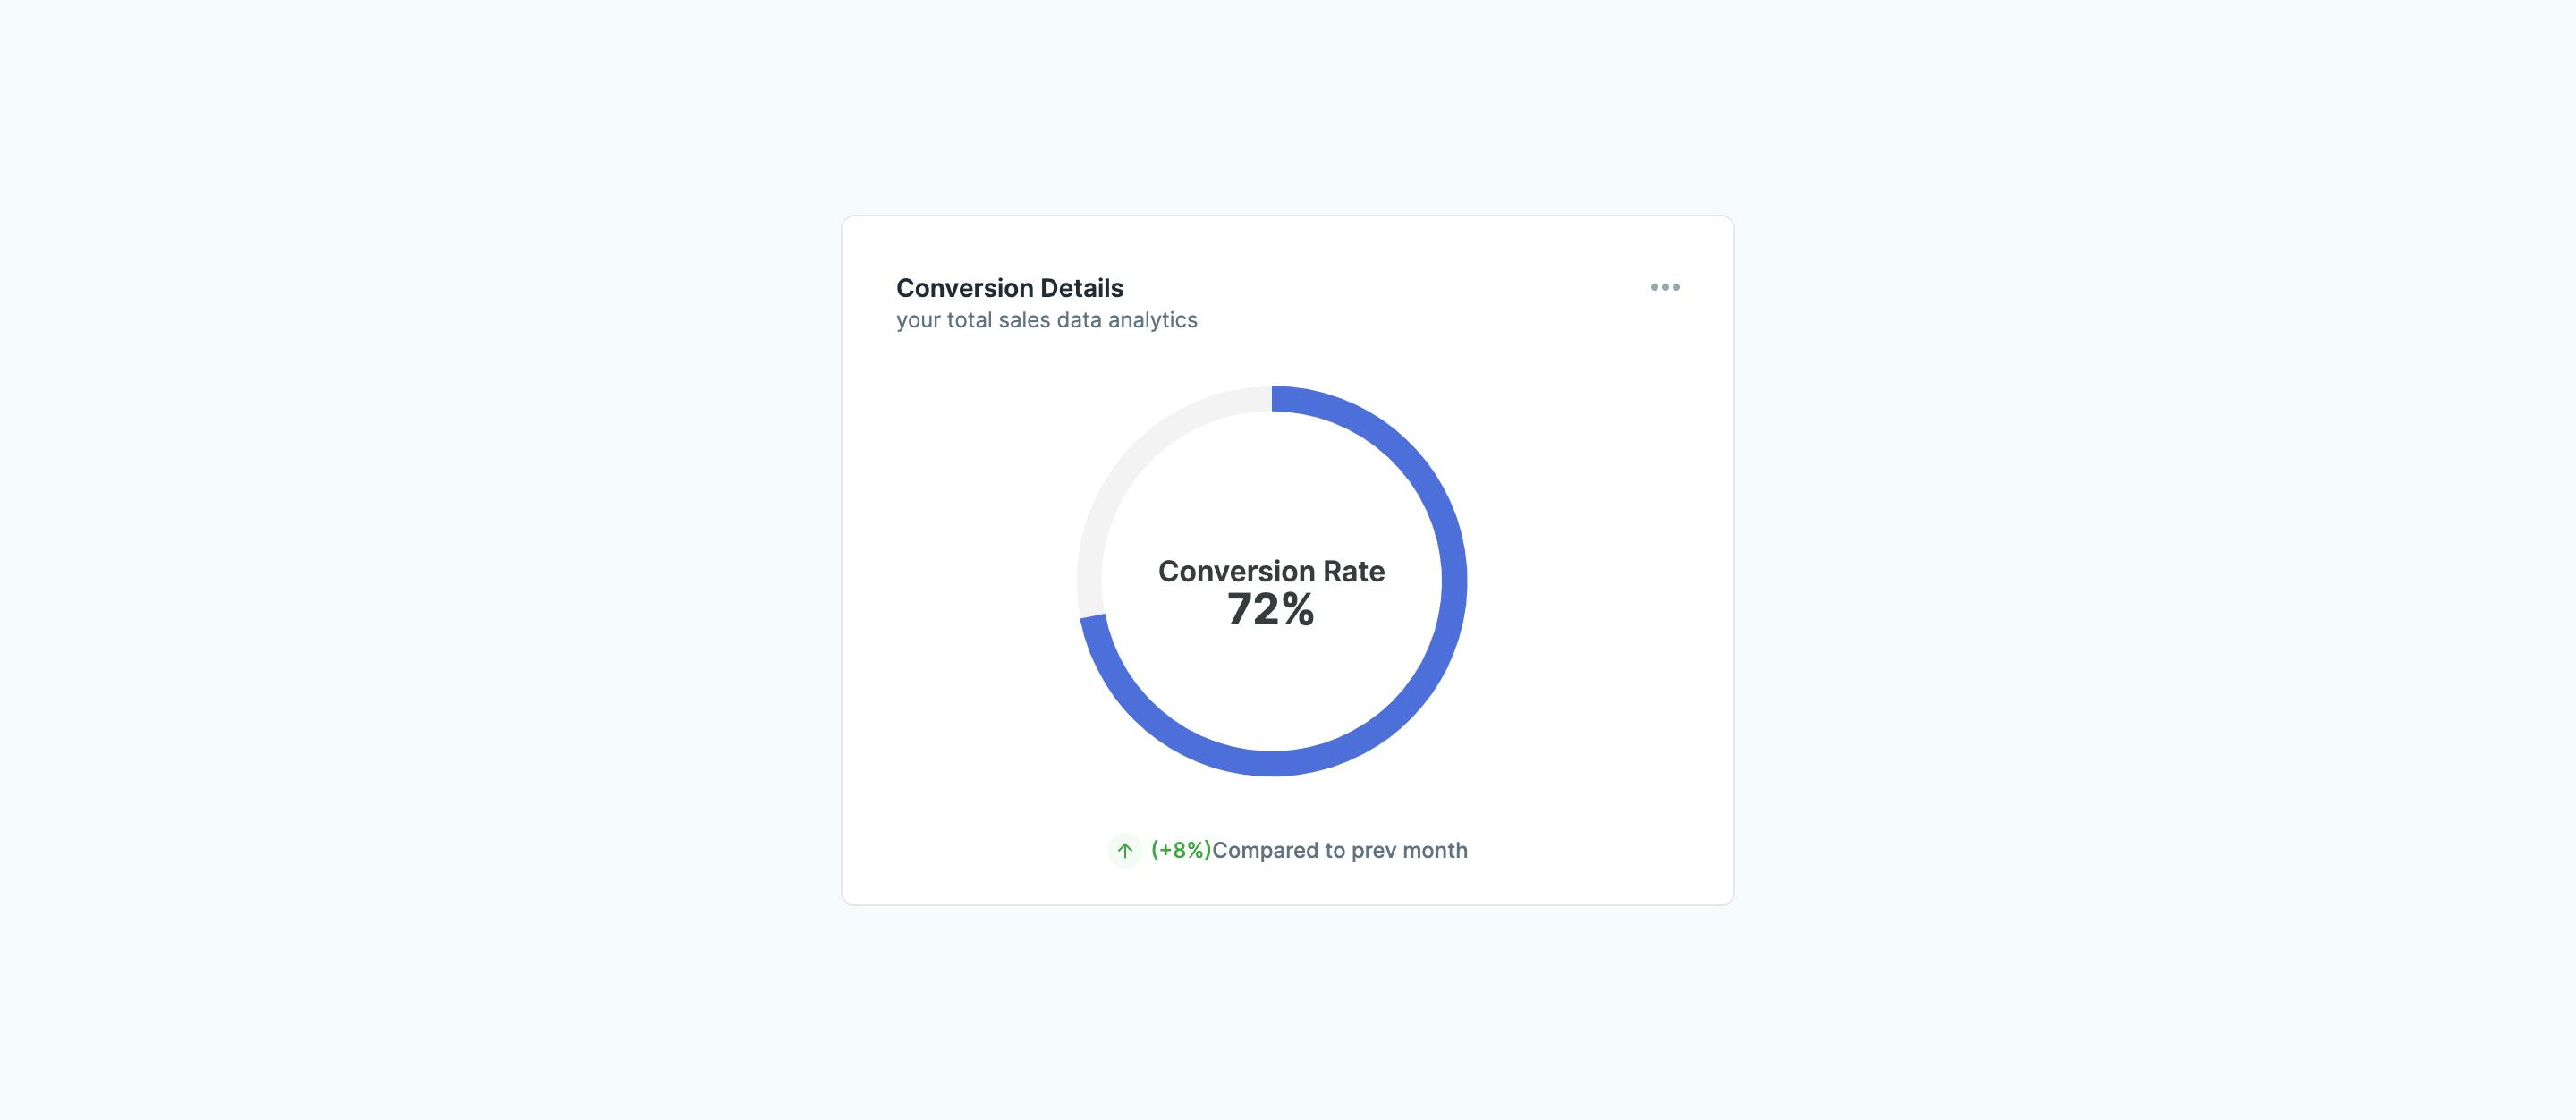
React Conversion Rate Gauge
A radial gauge chart displaying the current conversion rate in React applications with a comparison to the previous month. It includes a text label indicating whether there is a positive or negative change.
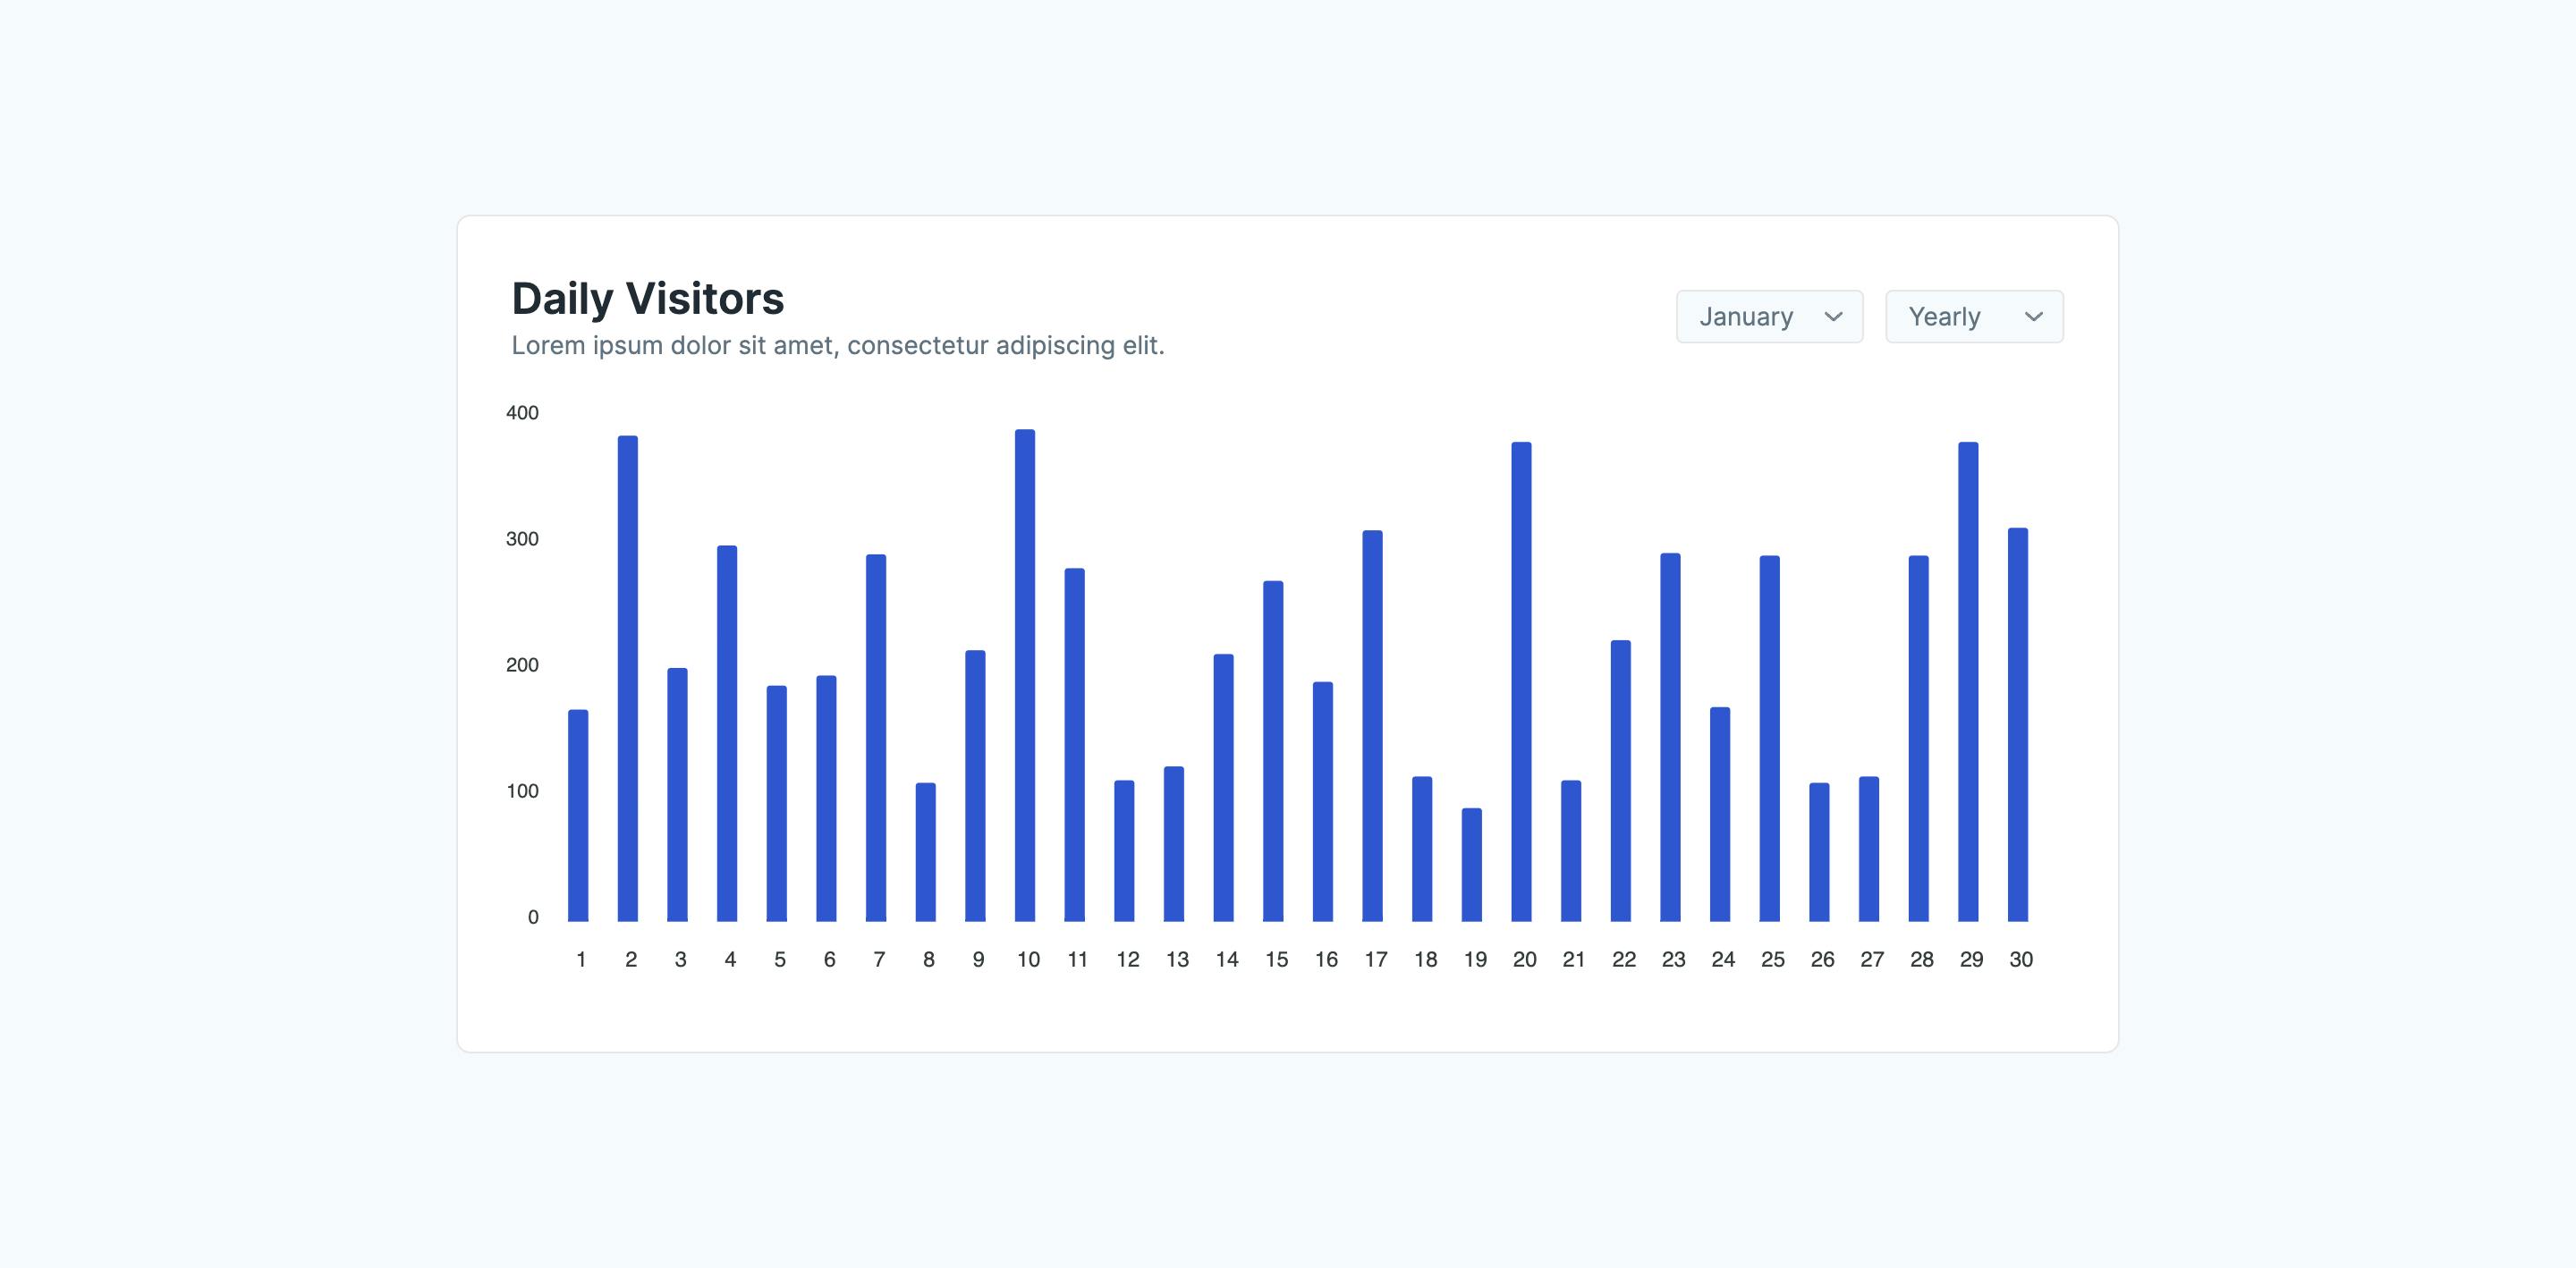
React Daily Visitor Bar Chart with Monthly/Yearly View
A bar chart component for React to visualize daily website visitor trends. It offers toggles for monthly and yearly views, making it easy to analyze traffic patterns over different timeframes.
React Line Chart with Data Points
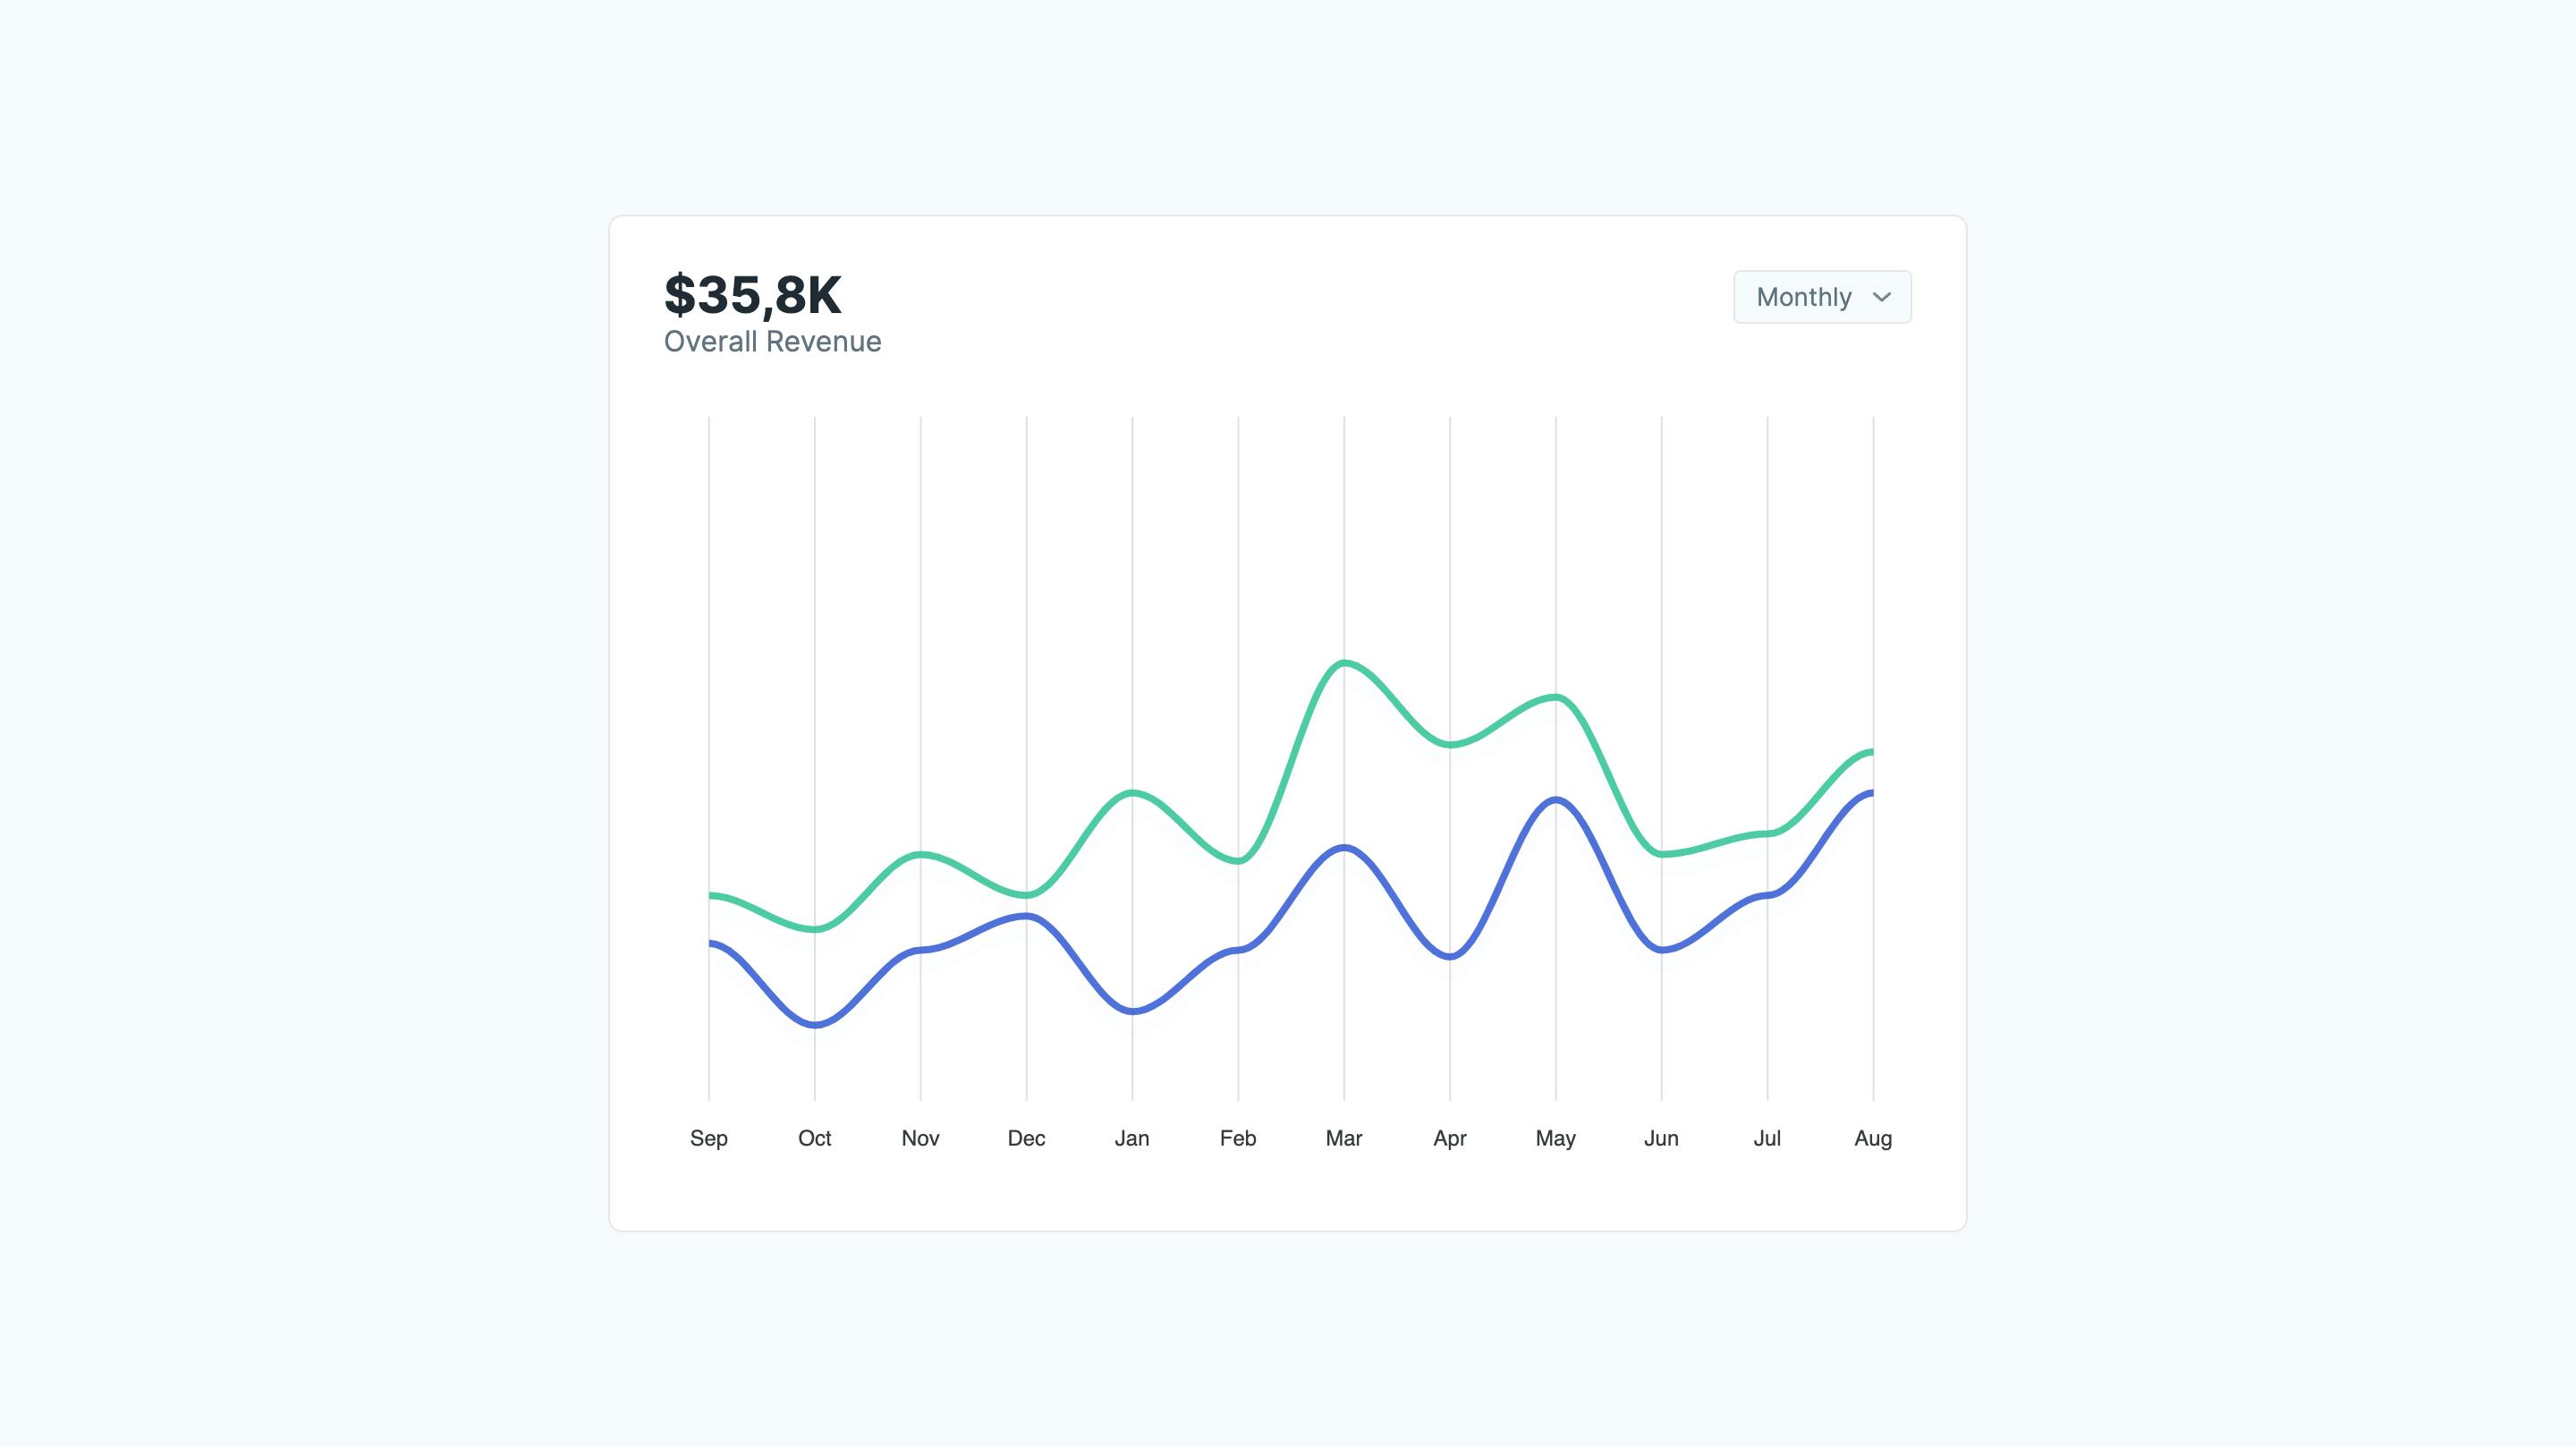
A line chart component for React projects. It showcases two datasets, "Product One" and "Product Two," over time. It includes a dropdown menu for selecting timeframes (monthly or yearly) and distinct data points for each product.
React Multi-Line Area Chart with Time Period Toggle
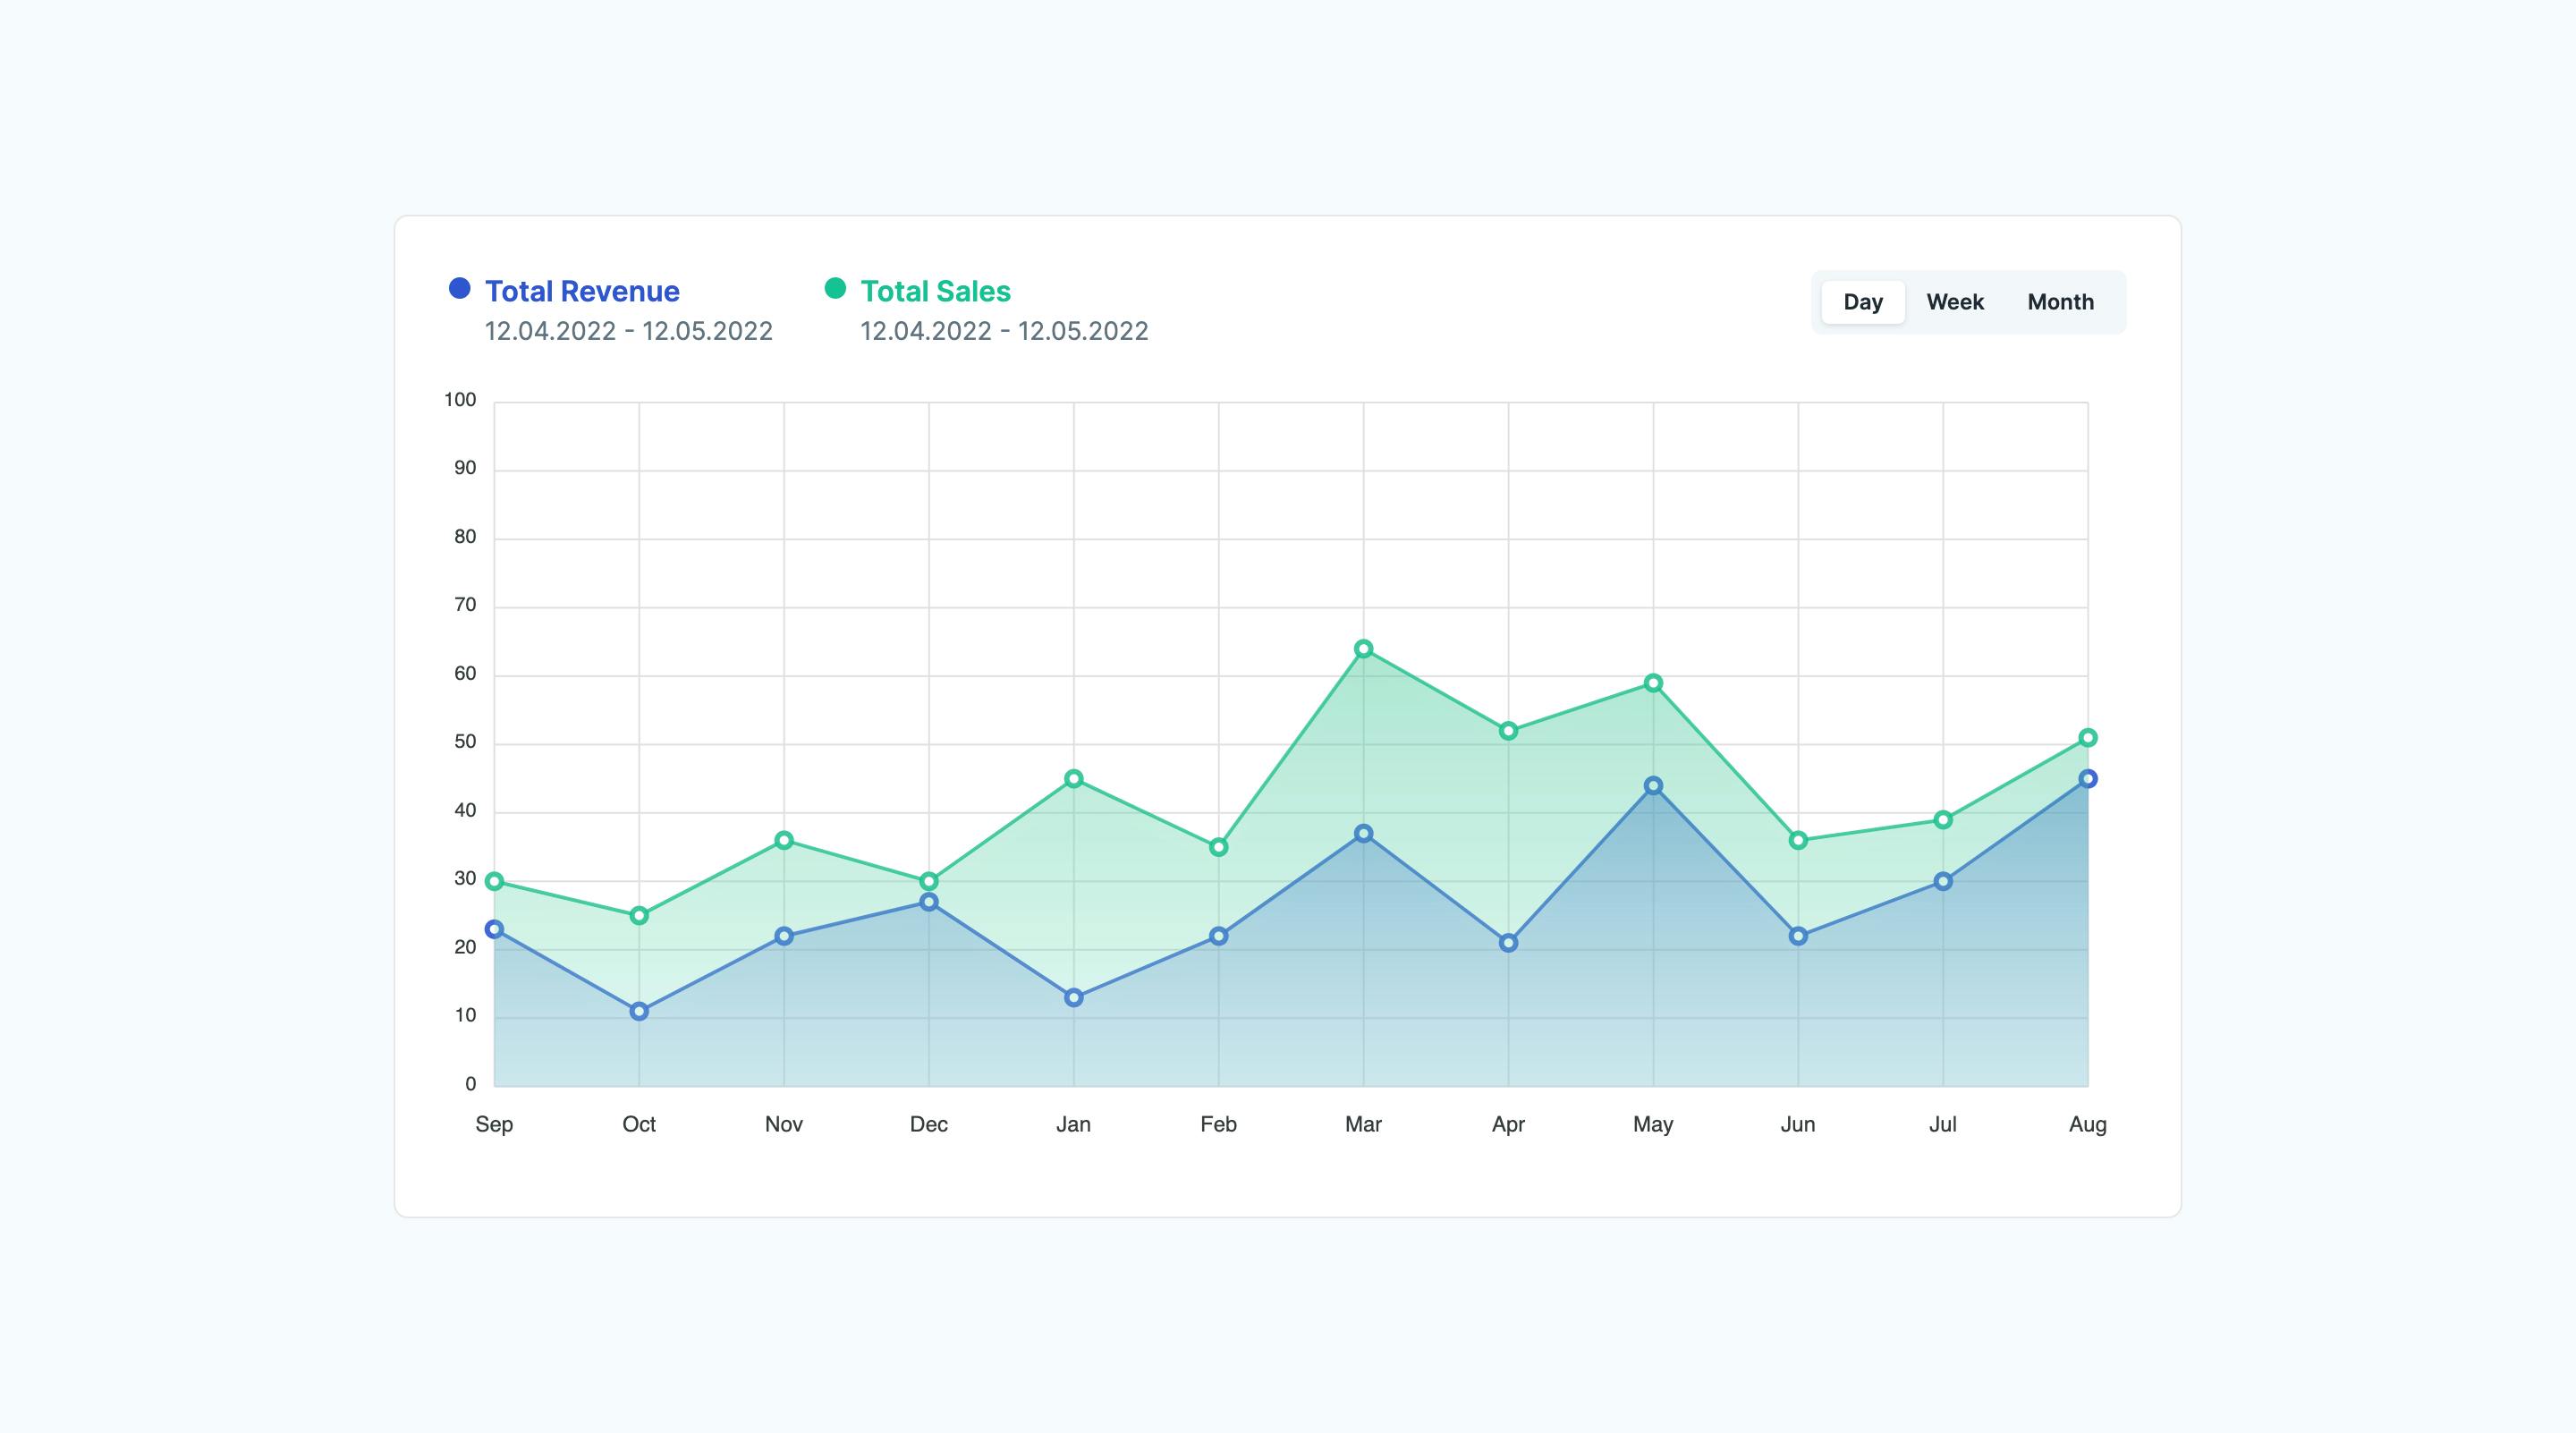
A stunning chart for tracking revenue and sales data over time. It features multiple data series shown as colored areas with marked data points, and a button group in the top right for switching between daily, weekly, or monthly views.
React Radial Bar Chart
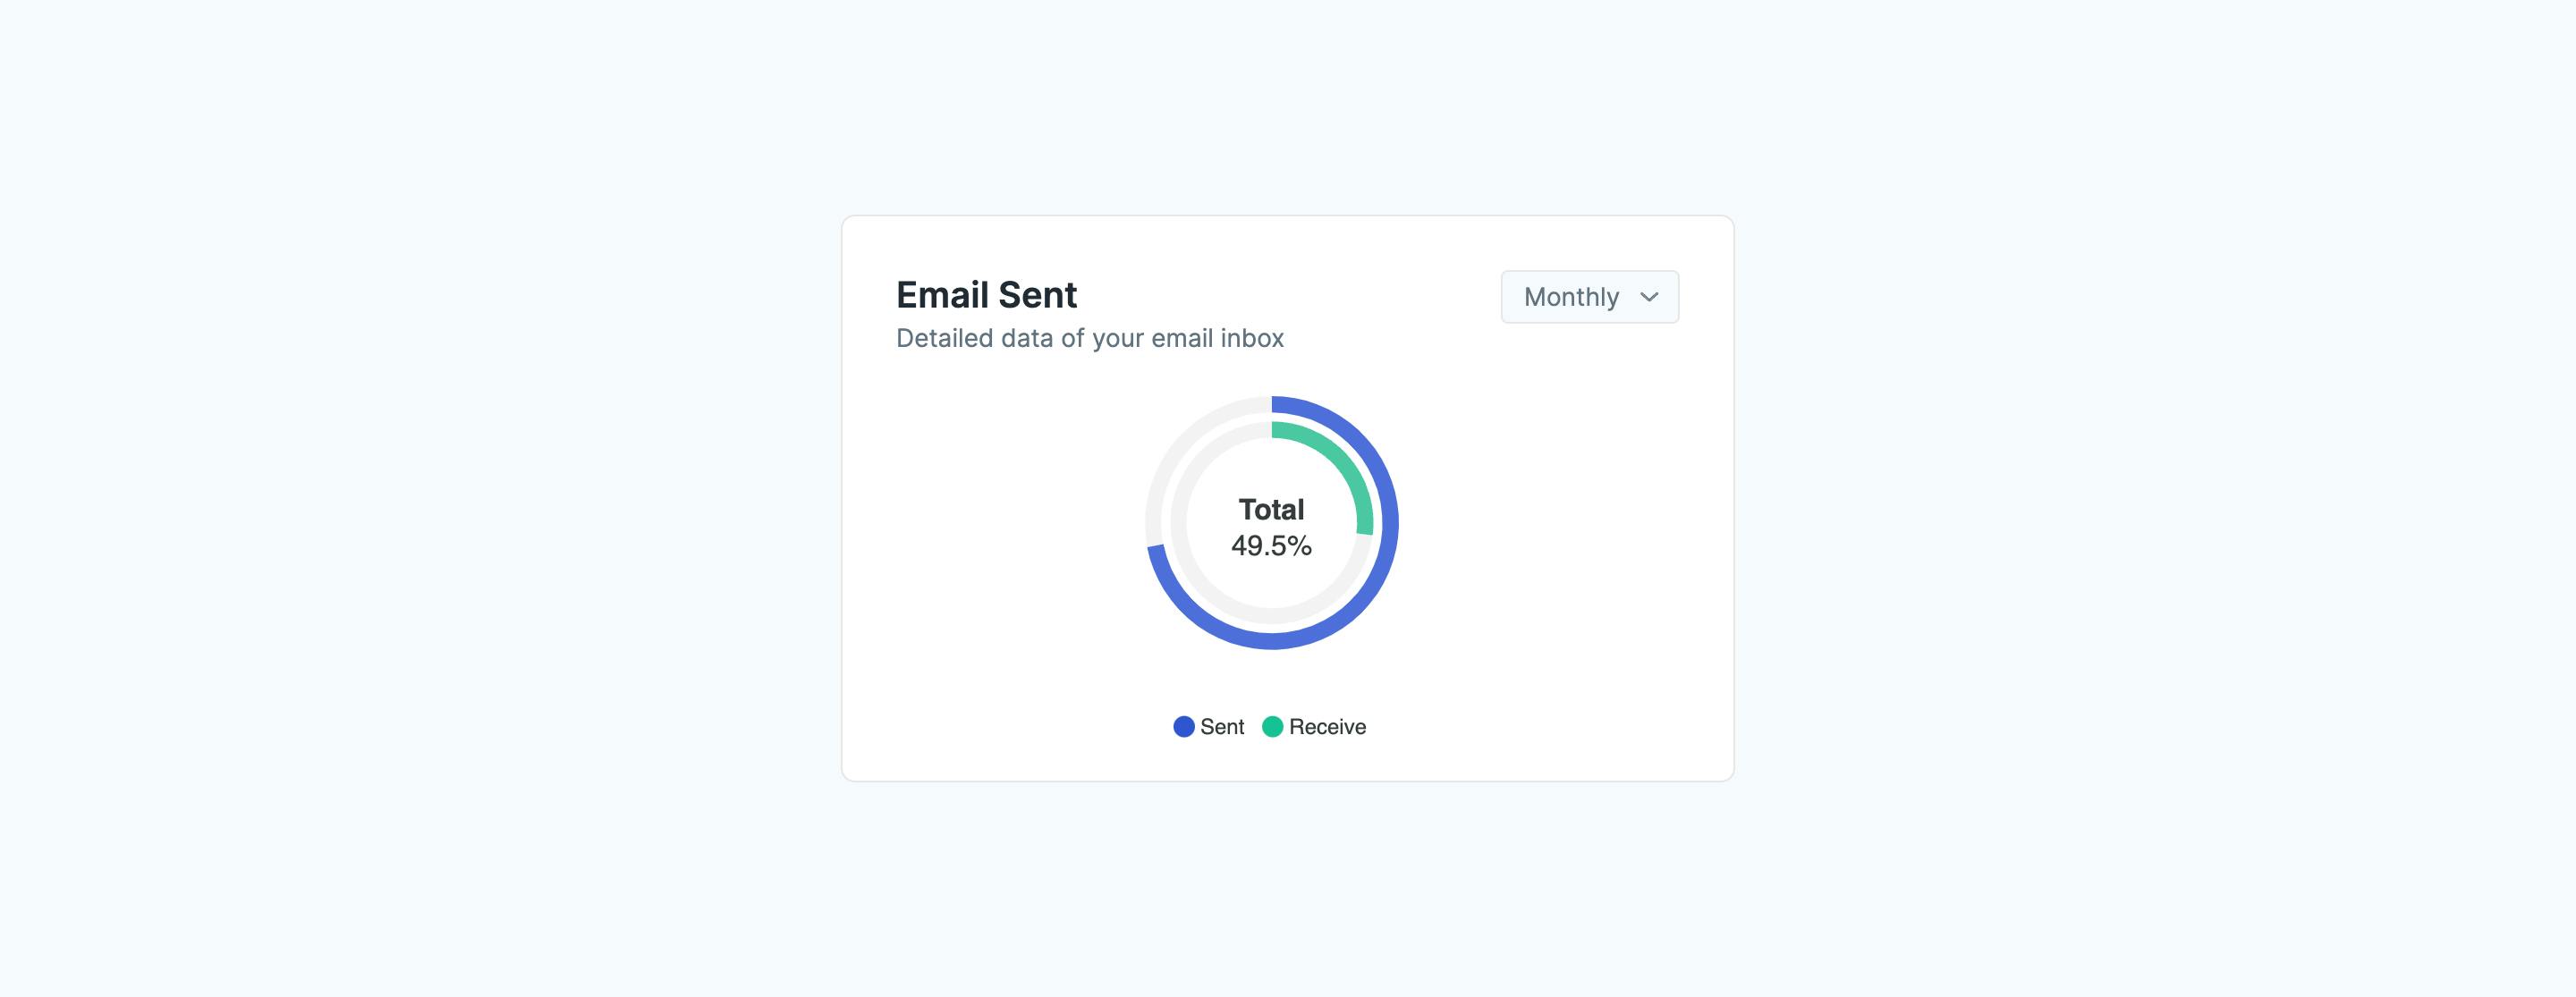
A radial bar chart component in React for comparing sent versus received emails. It visually represents the proportions of each category, allowing users to easily see email activity. A dropdown menu enables switching between monthly or yearly views.
React Radial Storage Usage Gauge with Label
A radial gauge chart for visualizing storage usage, showing the percentage of used space and available storage remaining. This component includes a "Clean" button to facilitate freeing up storage space.
React Stacked Bar Chart for Sales
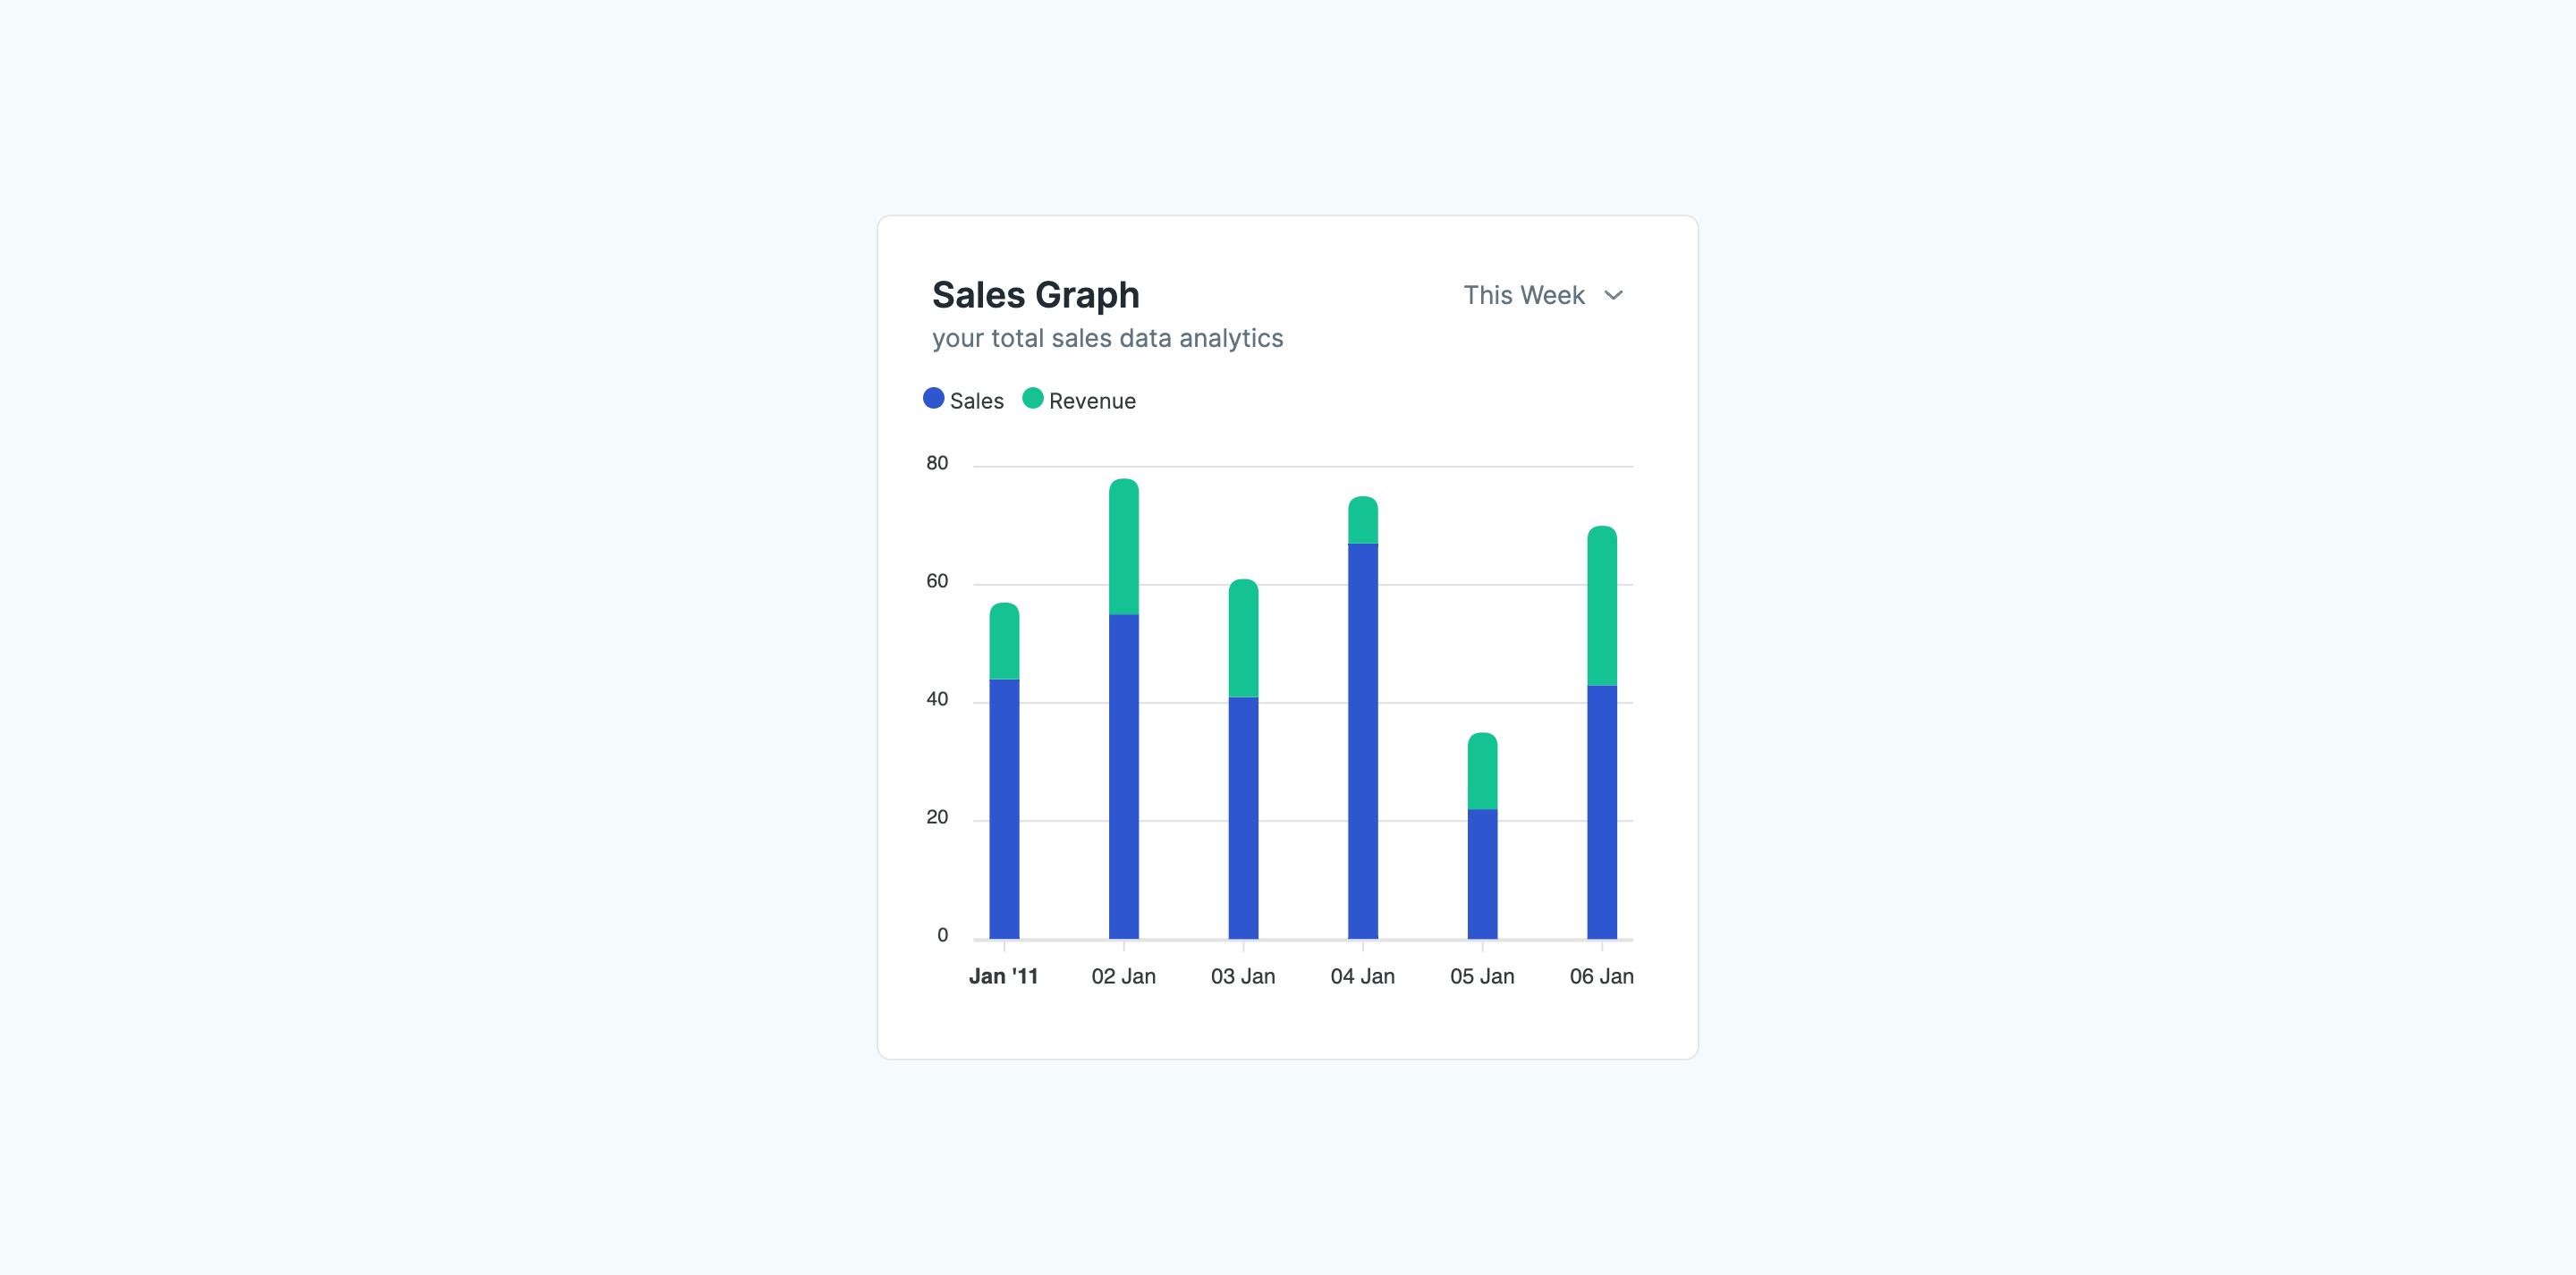
A stacked bar chart for visualizing sales and revenue over time in React applications. It includes separate bars for "Sales" and "Revenue" and features a dropdown menu to switch between monthly and yearly views, facilitating trend analysis and data comparison.
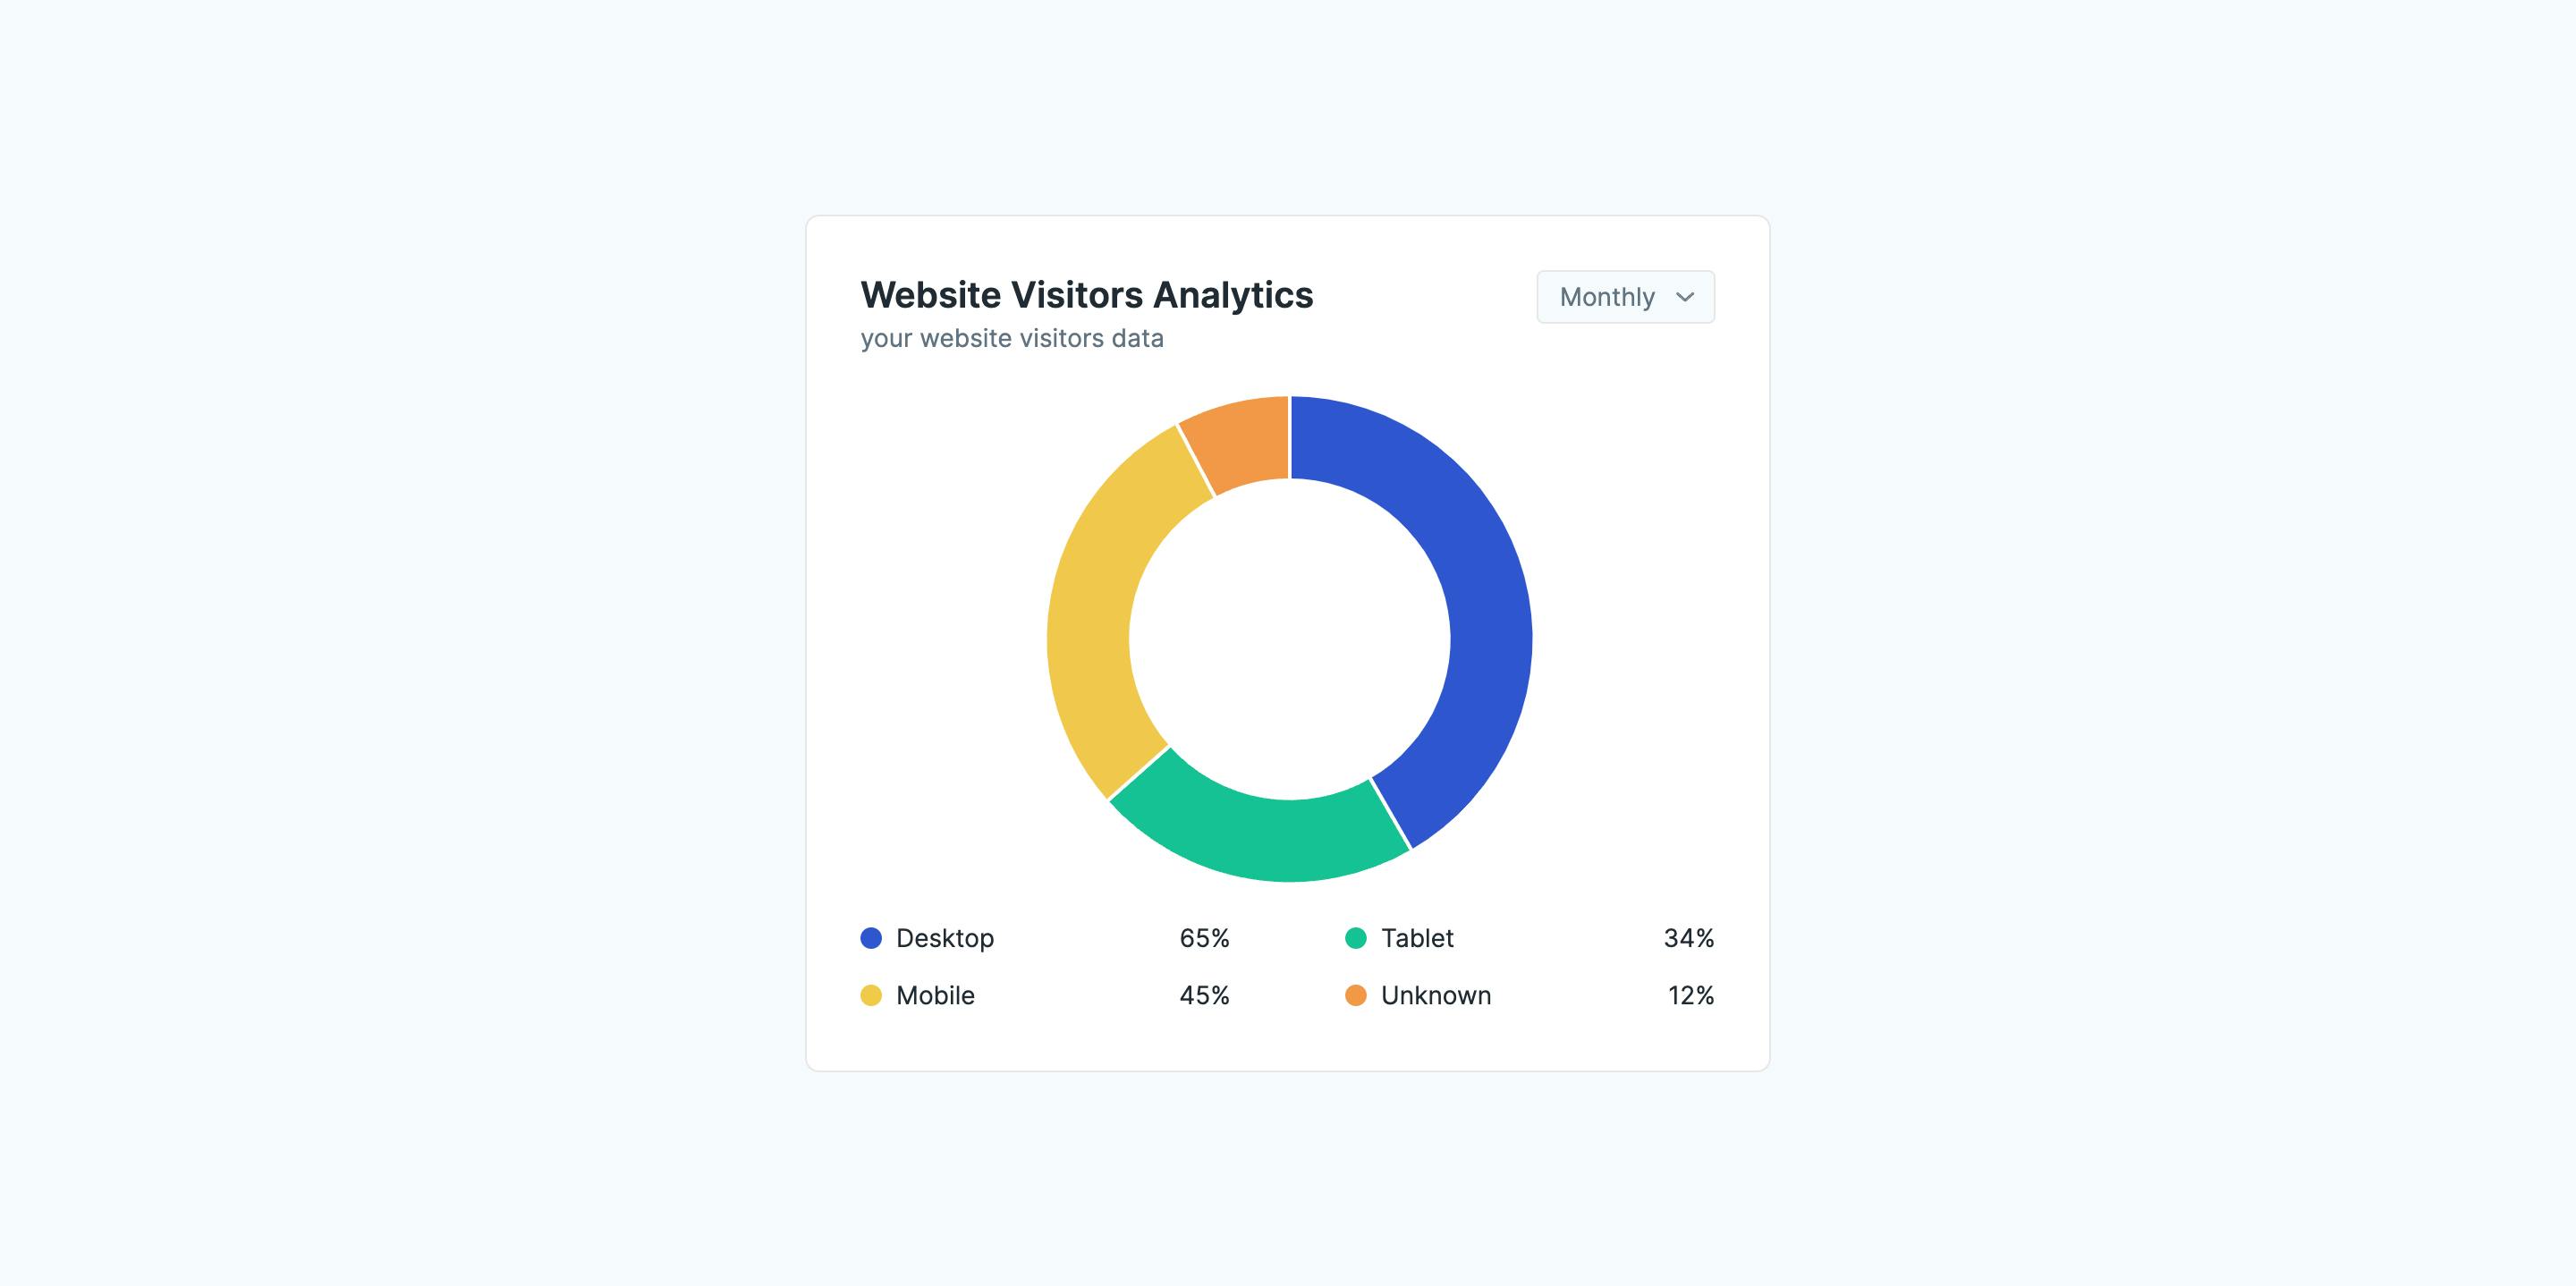
React Website Visitor Analytics Donut Chart
A striking donut chart showcasing website visitor distribution by device type (desktop, tablet, mobile, unknown). It offers a clear percentage breakdown for each category, facilitating easy analysis of user device preferences.
